
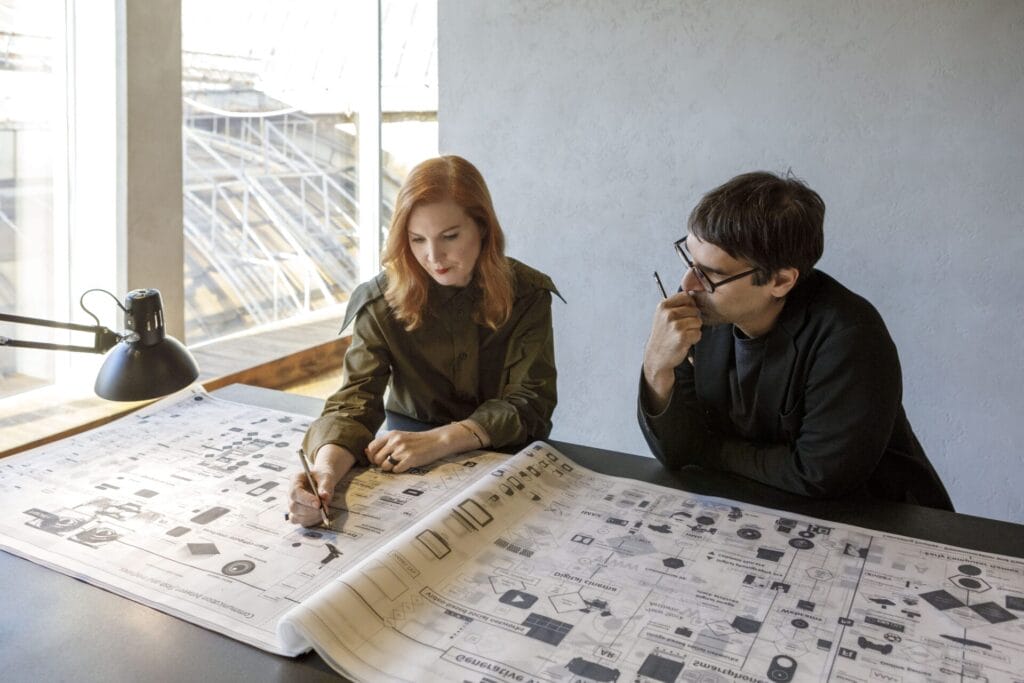
Fondazione Prada presents an exhibition titled “Calculating Empires: A Genealogy of Technology and Power, 1500-2025” by Kate Crawford and Vladan Joler from 23 November 2023 to 29 January 2024 at the Osservatorio, its space located at Galleria Vittorio Emanuele II in Milan.
Osservatorio is Fondazione Prada’s centre devoted to visual experimentation and research on potential intersections and collisions between technologies and cultural expressions. It is a free-thinking platform open to reflection on various artistic and media languages and their impact in an ever-changing political and social landscape.
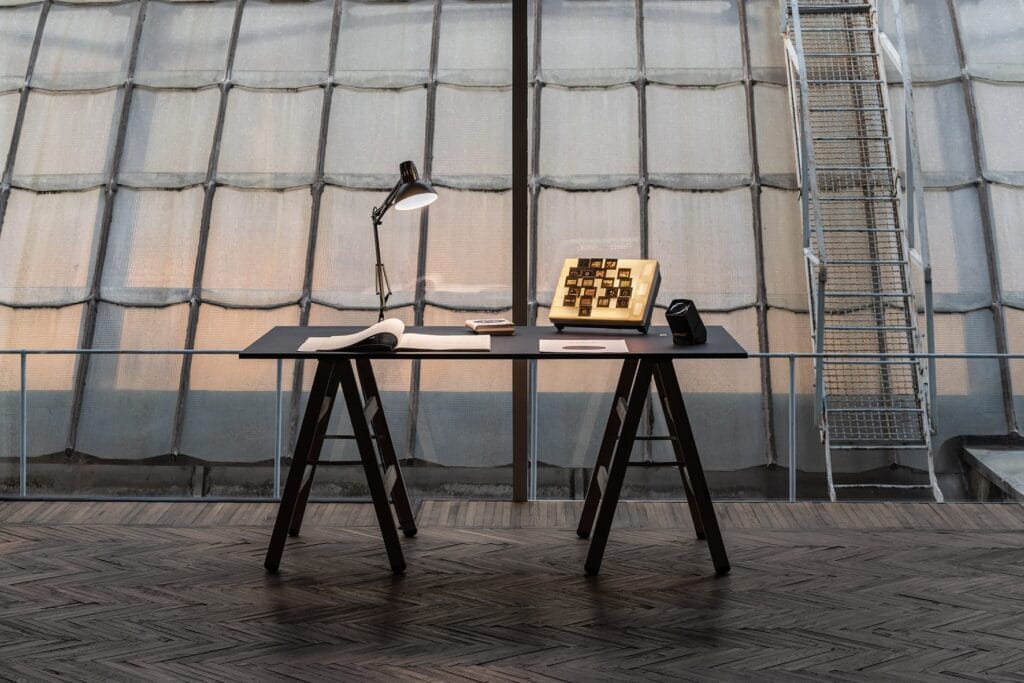
Photo: Piercarlo Quecchia – DSL Studio / @piercarloquecchia – @dsl studio Courtesy: Fondazione Prada
Conceived by researcher-artists Kate Crawford and Vladan Joler, “Calculating Empires” charts our technological present by depicting how power and technology have been intertwined since 1500. By merging research and design, science and art, Joler and Crawford create a new way to understand the current spectacles of artificial intelligence by asking how we got here — and consider where we might be going. This vast, mind-expanding installation invites visitors to experience the longue durée through a visualization of time, politics, and technology.
As Joler explains, “This is the year when generative artificial intelligence has flooded global culture, and dominated attention spans. Millions of people have changed the way they search, write, and make images. But these systems have already shown a capacity to concentrate power, produce ‘hallucinations’ and misinformation at scale, and challenge the perception of a shared reality. Generative AI also has a significant impact on our ecologies, requiring vast amounts of energy, water and minerals.” Crawford adds, “All of these diverse global impacts — from the political to the material — have developed over centuries. But they are obscured by cultures of corporate secrecy and technical architectures, the complexities of colonialism, planetary supply chains, opaque labor contracting, a lack of regulation, and by history itself. ‘Calculating Empires’ contends with how to visualize and critique these systems over time.”
The centerpiece of the exhibition is the Calculating Empires Map Room. Here the audience is immersed in a dark environment — like walking into a literal black box. The work, presented to the public for the first time, is a diptych of maps: one speaks to the themes of communication and computation, the other explores control and classification. This map room is an intense physical experience, a vertiginous encounter with five hundred years of history. It is designed to calculate empires, and to explore how empires themselves have calculated.
Calculating Empires is a codex of technology and power which shows how the empires of past centuries are echoed in the technology companies of today. This detailed visual narrative extends over 24 meters and took almost four years to create, illustrating forms of communication, classification, computation and control with thousands of individually crafted drawings and texts that span centuries of conflicts, enclosures, and colonizations.
Calculating Empires proposes a slower way of reading, placing emerging technological devices and discoveries into a much longer historical and political context. This approach prioritizes complexity, reading across time and phenomena, and clustering movements together to see long-term patterns. One map reveals the multiplicity of our communication devices, interfaces, infrastructures, data practices, and computational architectures and hardware. The other map explores how these technologies are woven into social practices of classification and control: from prisons to policing, time to education, colonialism and economic production, to the multitude of military systems.
It is no coincidence that Calculating Empires maps begin in the 1500s, a century in which two enormous political, social, and cultural shifts were underway, movements that would expand for hundreds more years. On one hand, new maritime and trade routes opened up, expanding the colonization and subjugation of indigenous people. On the other, Gutenberg’s printing press became an instrument of profound cultural change that led to the reorganization of networked information power. We are at another moment of global transformation, with war, generative AI, climate crisis, and profound uncertainty shaping public discourse.
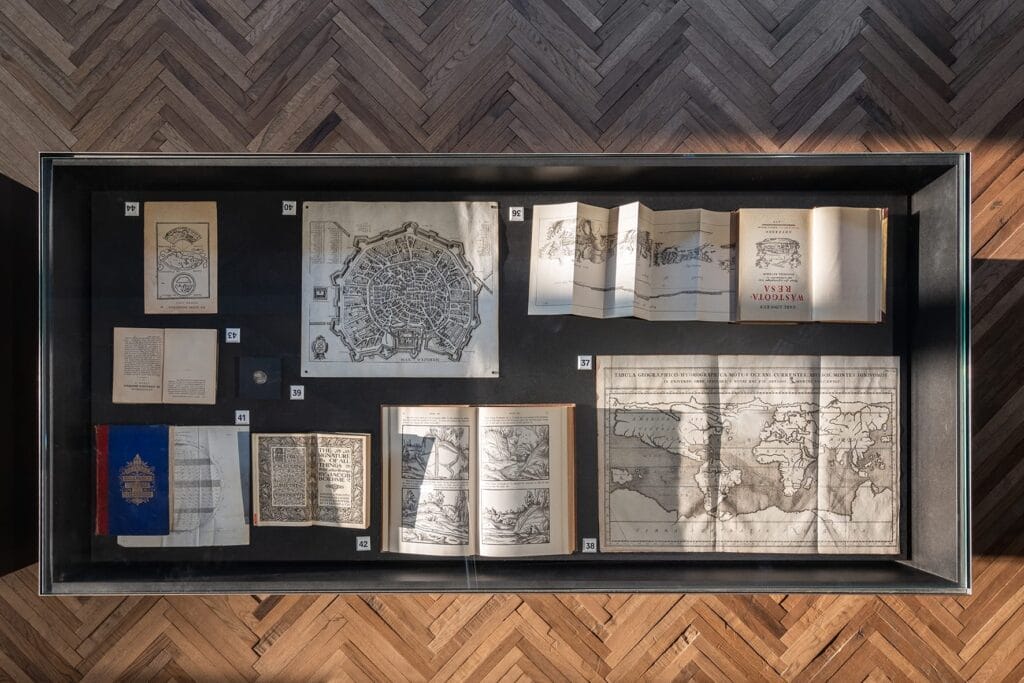
Photo: Piercarlo Quecchia – DSL Studio / @piercarloquecchia – @dsl studio Courtesy: Fondazione Prada
Calculating Empires takes inspiration from large-scale projects such as Aby Warburg’s Atlas, developed during the 1920s to compile and juxtapose patterns, ideas, and motifs across thousands of years of human culture, and the Eames’ “Mathematica” exhibition in the early 1960s, which addressed the complex history of mathematics through art, design, and education. In different ways, Warburg and the Eames’ developed languages of visual representation at scale to convey complex ideas and historical narratives, which were also political interventions into how we perceive and interpret history. Following this tradition, Calculating Empires looks at five hundred years of history in order to make political observations about the dangers of centralized power and control over human subjectivity and autonomy.
To contextualize this new work, the visitor first encounters Joler and Crawford’s Anatomy of an AI System, part of the permanent collection of MoMA in New York and the V&A in London. Anatomy of an AI System is an exploded view diagram focusing on the case study of the Amazon Echo voice-assisted AI. This anatomical map visualizes the three central extractive processes required to run any large-scale AI system: material resources, human labour, and data. Deep interconnections exist between the literal hollowing out of the Earth’s materials and the data mining of human communication, culture, and connection. Where Calculating Empires is about time, Anatomy of an AI System is about space.
If the visitor reads the map from left to right, the story begins with the Earth and the exploitation of deep-time geological processes and ends with the decay of toxic electronic waste in the ground. But if the audience reads it from top to bottom, the story begins and ends with a human being. At the top is the human user, talking to the Echo and, at the same time, providing Amazon with valuable verbal response training data that it uses to refine its voice-activated artificial intelligence systems. At the bottom of the map is another human story: the entire history of human knowledge and culture, which is currently being extracted to train and optimize artificial intelligence systems.
The Anatomy room looks at the hundreds of nested supply chains of minerals, energy and human labor that has driven the rise of AI. It includes a dissected Echo, a collection of all the individual minerals that are mined to make the Echo, and a display of the patents that outline Amazon’s corporate vision of AI. The patents reveal a plan to use AI to surveil the labor of factory workers, as well as the activities of neighbors as they walk along the street, and the alleged emotions and health status of every individual Echo user.
The project also includes a work realized by artist Simon Denny in 2019 that was directly inspired by Anatomy of an AI System . Titled Document Relief 1, 3, 22 (Amazon Worker Cage patent) 2019-2020, it is a recreation of Amazon’s patent for a cage to house workers inside distribution warehouses.
The exhibition concludes in a cabinet of curiosities, an eclectic collection of books, devices, and ephemera spanning from 1500 to 2023, and a space to reflect. There are physical examples of the objects and books illustrated in the map room, exploring the relationships between classification, computation, and control, from early calculation machines to semiconductor chips.
The final space is a small library that invites visitors to read, reimagine, and write their own additions, revisions, and complications of history in the hand-made volumes. Any exhibition that spans centuries will necessarily be incomplete, impartial, and subjective: it can never be finished. So these maps are designed to be open to feedback, and to change over time.
“Calculating Empires: A Genealogy of Technology and Power, 1500-2025” is accompanied by an illustrated publication in the Quaderni series, published by Fondazione Prada, including an essay by Kate Crawford and Vladan Joler.
